v4.1.0
latestv4.1.0 makes discovery protocol-aware: every captured connection is now labelled with the application protocol or framework it actually carries — gRPC, WebSocket, Arrow Flight SQL, HTTP/2, PostgreSQL, Redis, Kafka, MQTT — together with the signal the verdict came from and how confident it is. It also puts an end to configuring blind: SNMP OIDs and WMI queries are proposed from a catalogue and verified live on the target through the probe, log and folder rules can be tried against the real file, and downtime windows, SLA exclusions and report scopes all show what they will affect before they are committed.
+ New features
-
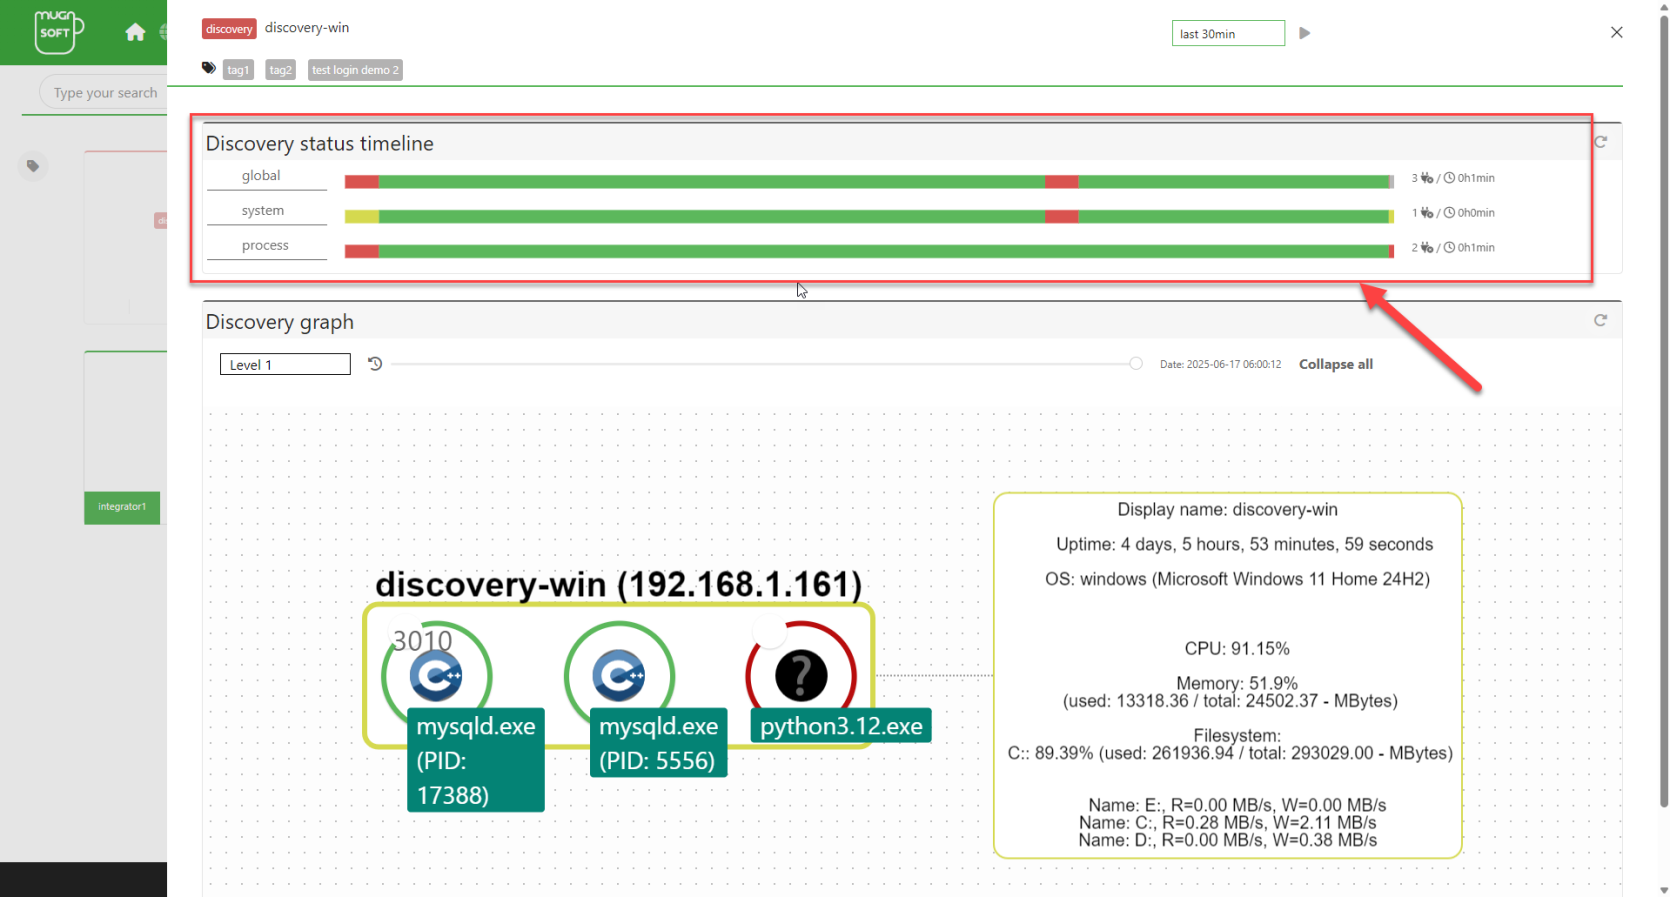
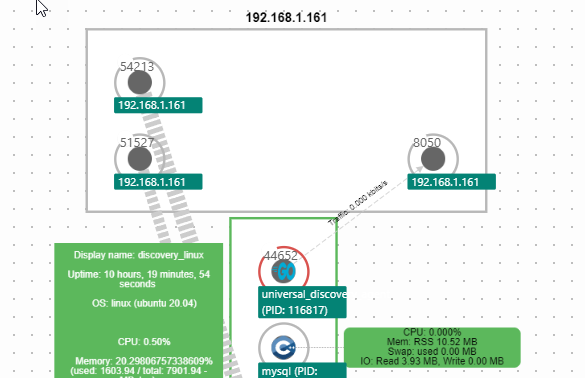
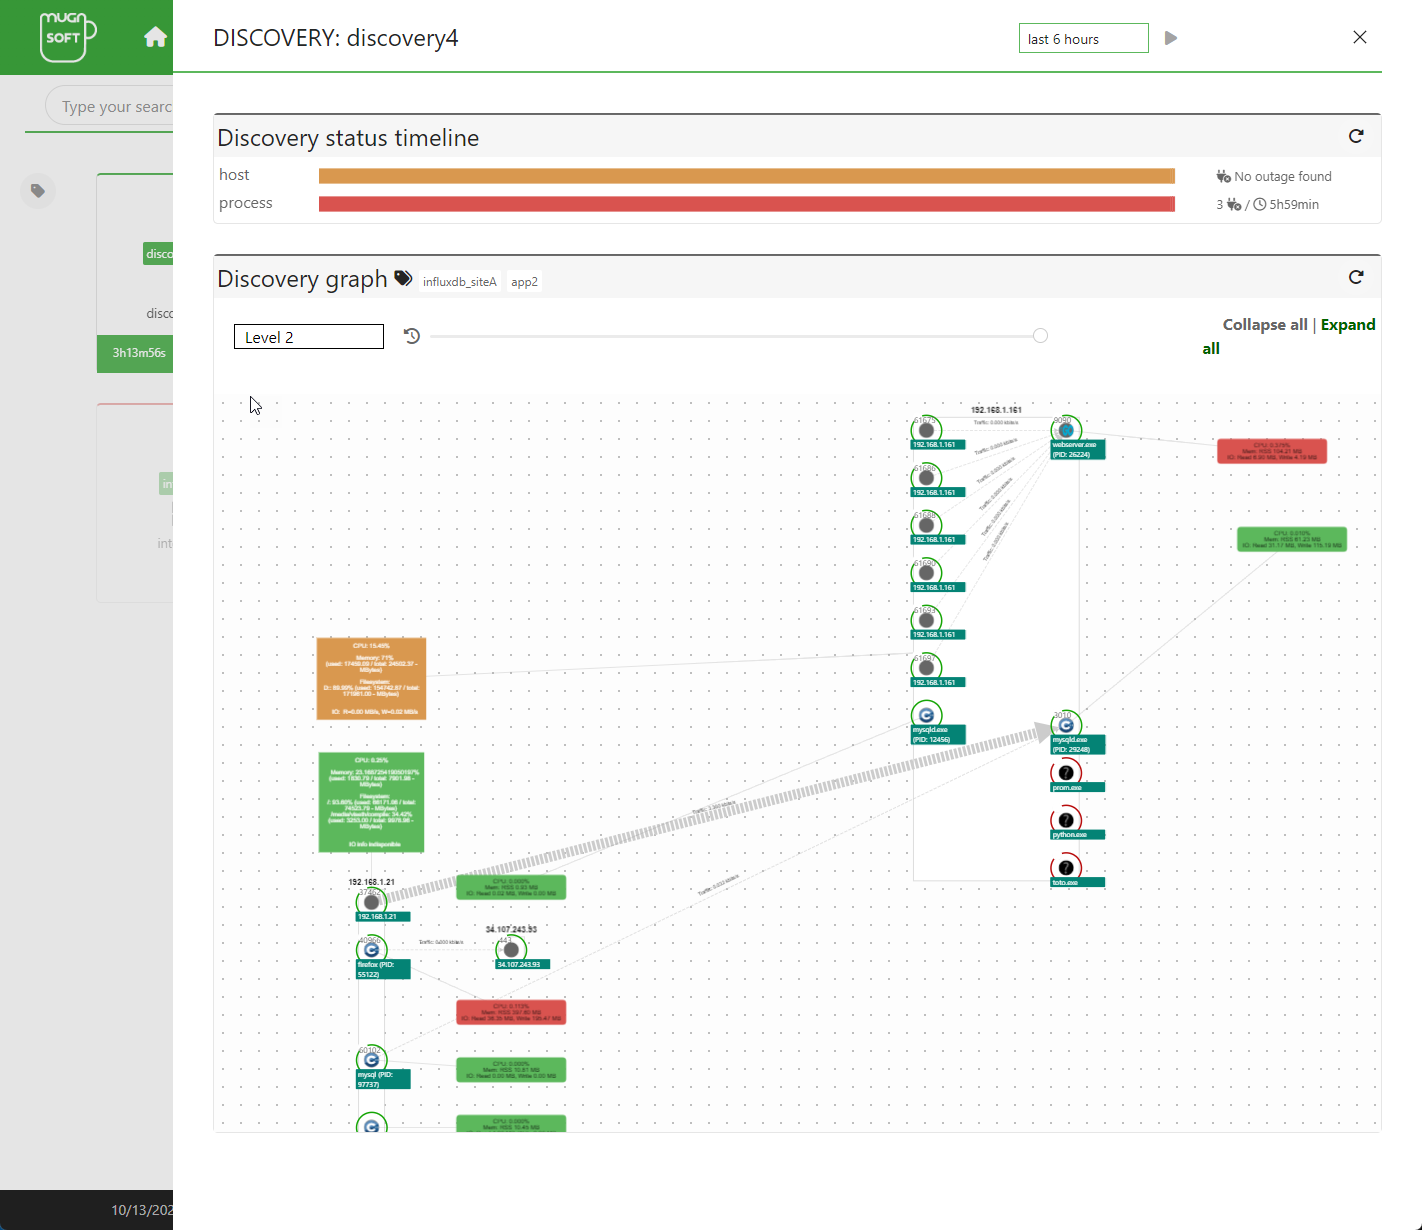
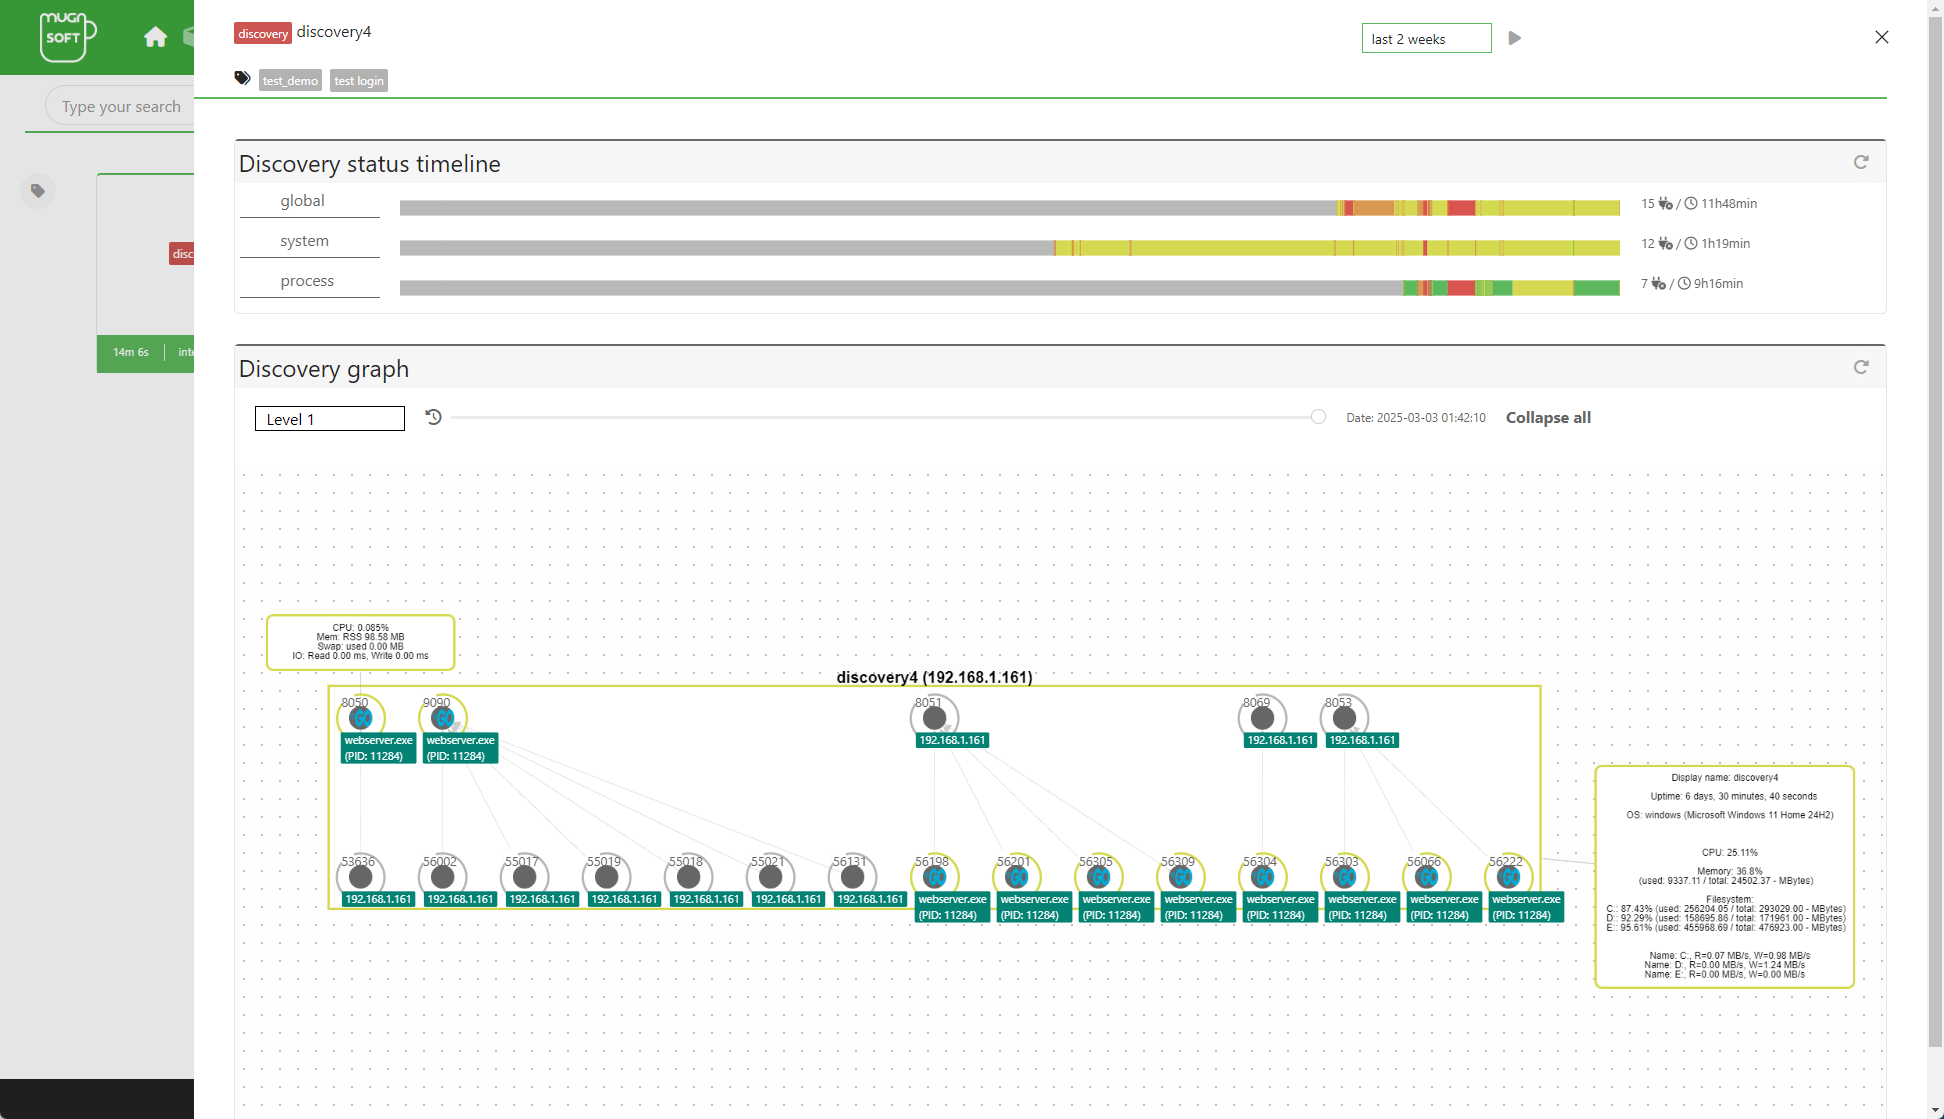
Application-protocol identification on the discovery map.
Flow edges now carry the protocol or framework they transport. Three independent signals feed the verdict: signatures in the opening bytes of a flow (HTTP/1.x, HTTP/2, gRPC, Arrow Flight SQL, WebSocket, PostgreSQL, MySQL, Redis, AMQP, Kafka, MongoDB, MQTT, SSH), TLS handshake metadata (ALPN and SNI, always cleartext), and process/port inference as a last resort.
Every label states its source (
dpi,alpn,process,port) and its confidence (observed,inferred,guessed), so an inferred protocol is never read as a measured one. The map can be filtered by protocol, and detection can be switched off per agent. - SNMP OID and WMI query assistants. Both device types propose metrics from a catalogue keyed by device type, verify the whole selection in bulk against the real target through the probe, and let you save reusable named templates. An OID walk browser and a WMI class browser are available for anything the catalogue does not cover.
- Downtime calendar and impact preview. Downtime windows can be browsed as a month calendar next to the existing table, with a range picker for the period. Before saving, an impact preview lists exactly which monitors and applications the window will silence.
- SLA exclusion windows. Maintenance and known-issue periods can be excluded from SLA uptime with a documented reason. Outages inside a window no longer count against the SLA, and corrected periods are flagged with a ★ in the SLA history.
- Report scope preview. Every report type can resolve its tag, application and probe selection into the actual list of monitors it will cover, on demand, from the report form.
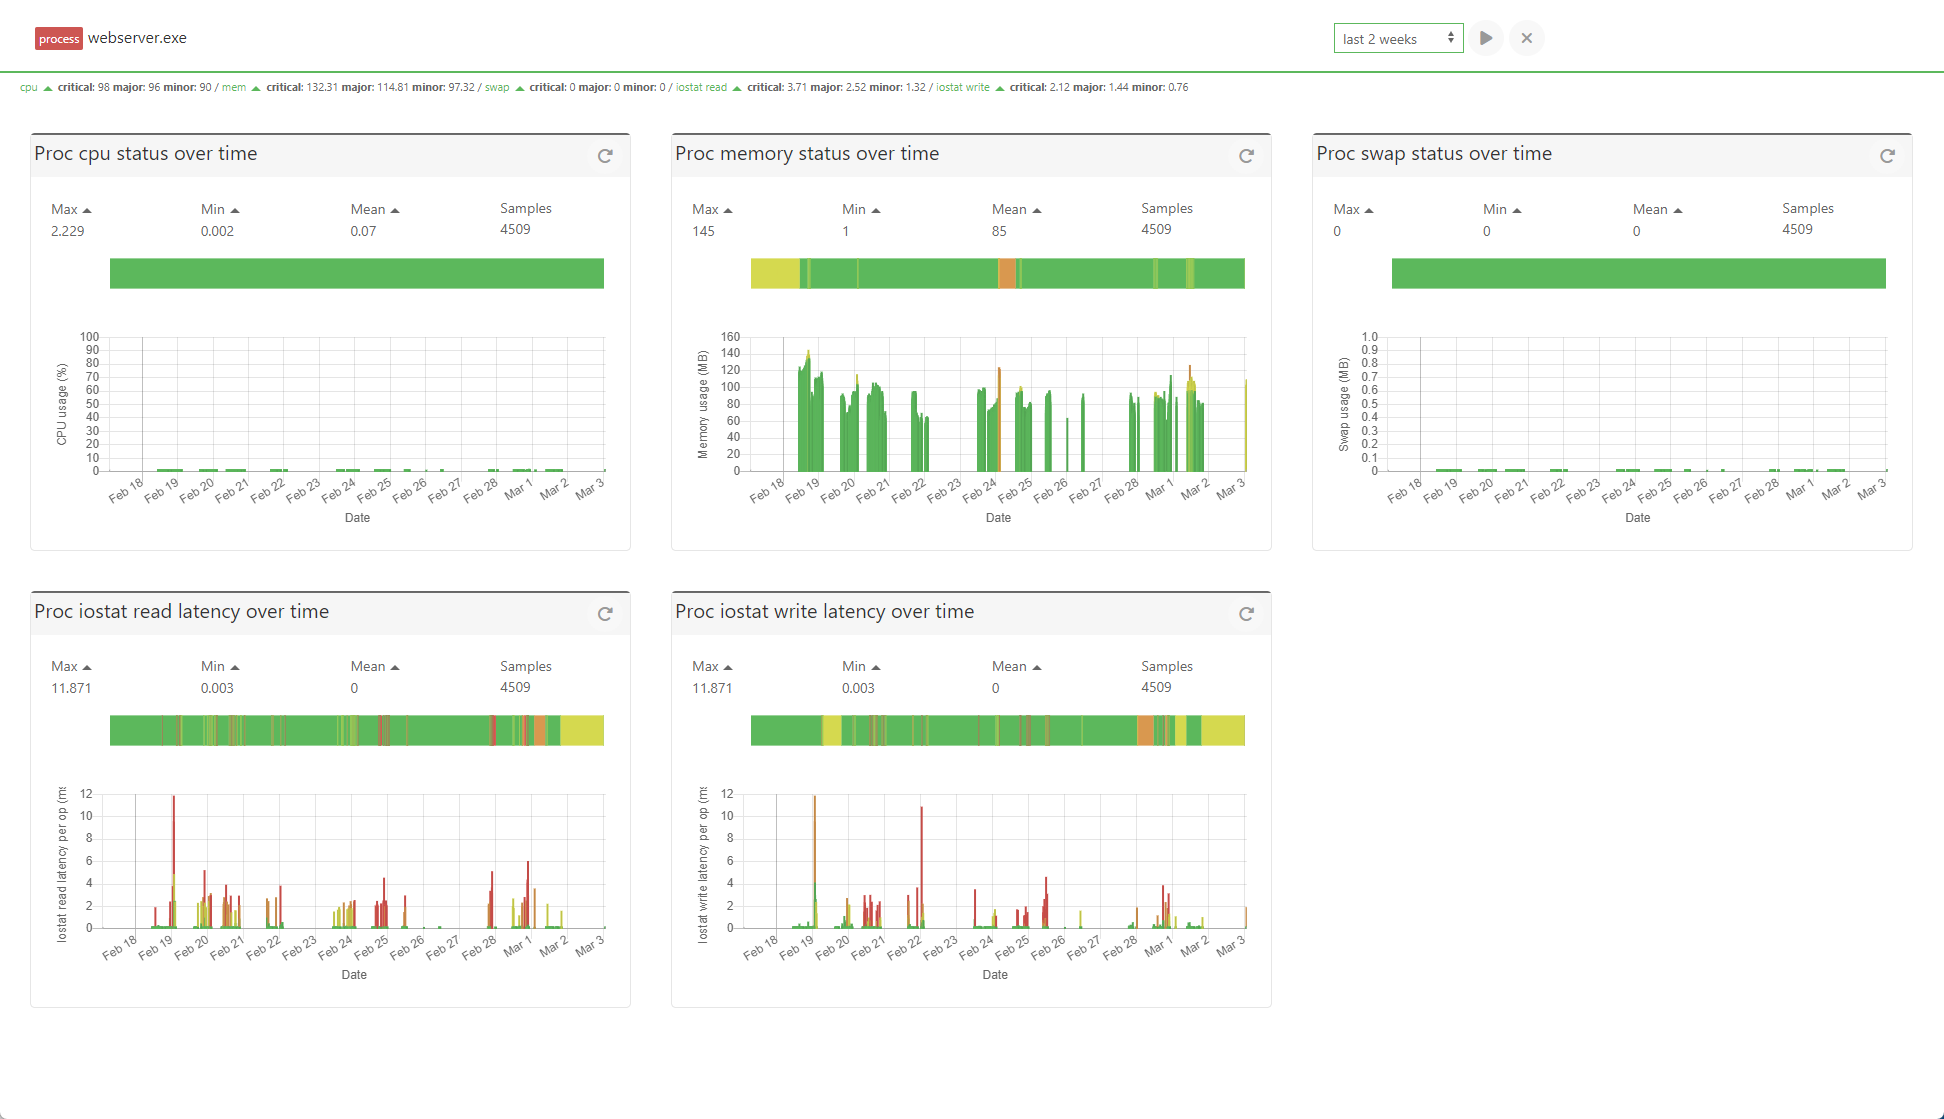
- Threshold provenance. For each system and process metric the interface states whether the threshold that governed the run came from the auto baseline or from the fixed fallback — a fixed value while auto is enabled means the baseline was unavailable. Fixed thresholds are editable per metric, and baselines can be recomputed on demand.
- Capture availability is reported, not guessed. When a host has no packet-capture runtime, the topology says so explicitly instead of showing zero traffic that looks like an idle host. A merged view only claims capture when every contributing agent had it.
- Log and folder monitor test. Log rules and directory rules can be run against the real file or folder from the interface, and their matches inspected, before the monitor is saved.
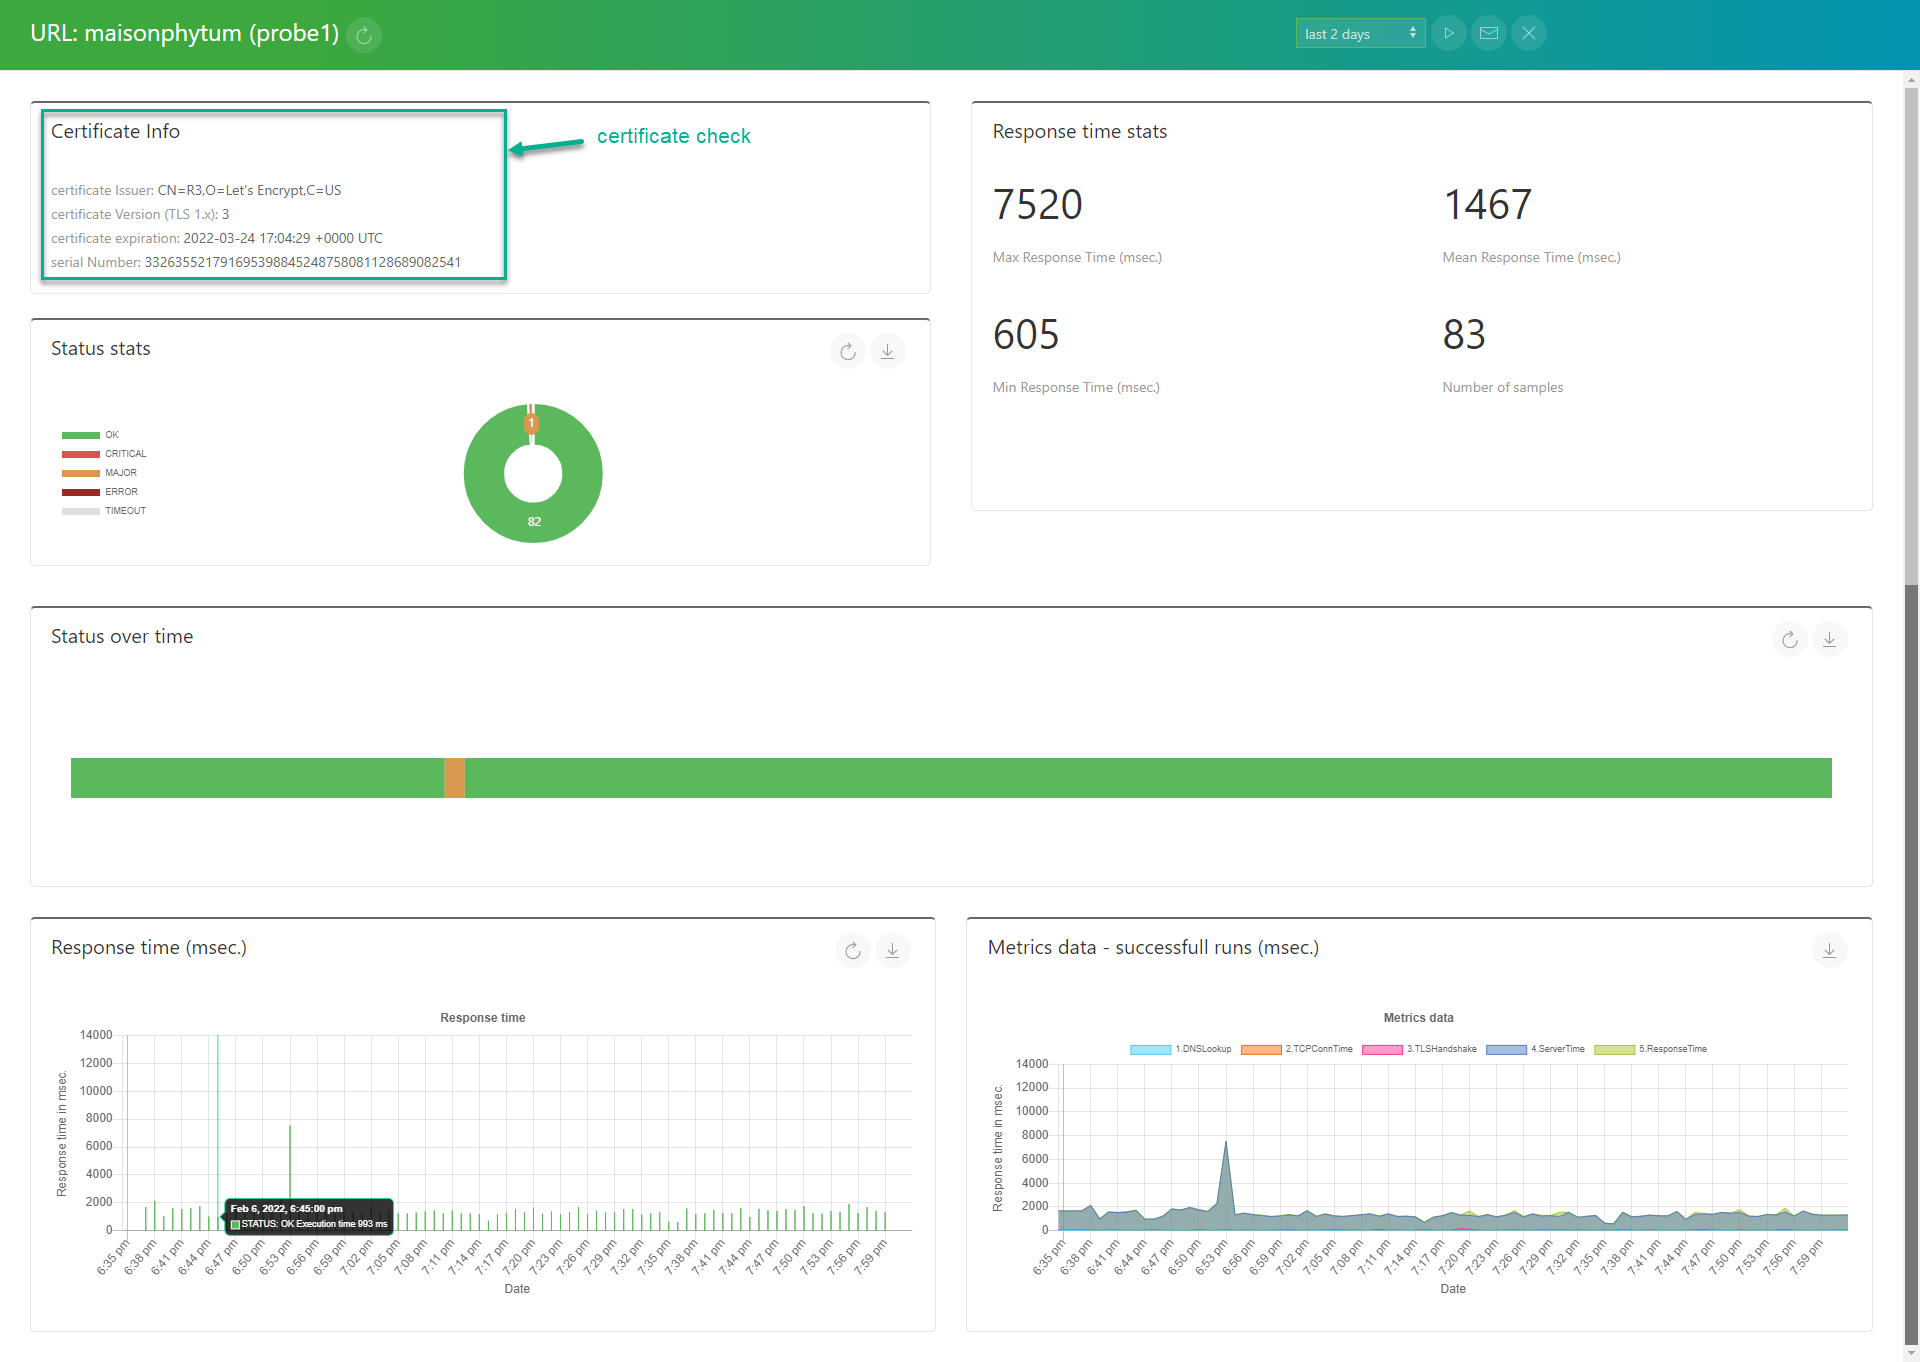
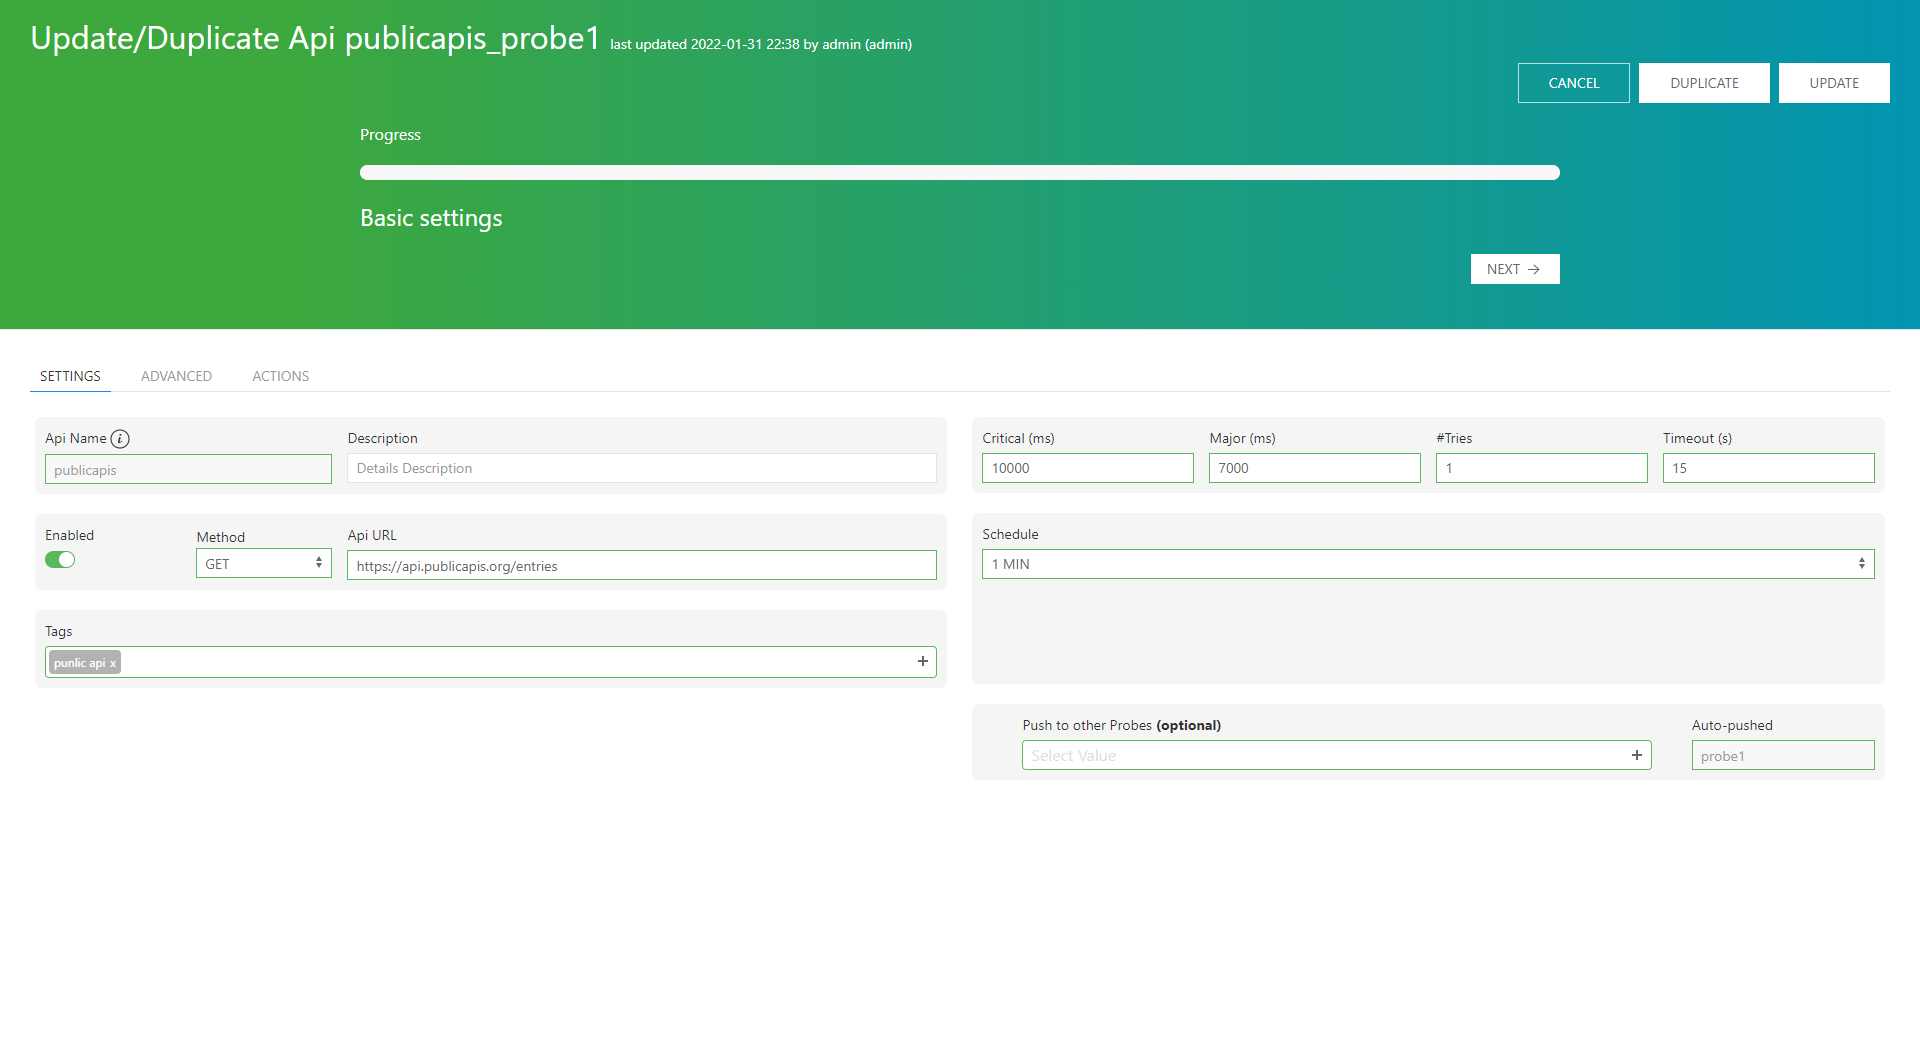
- Several named pattern groups per URL and API monitor, evaluated to a worst-status verdict, with contains checks and request bodies typed from their content type.
- URL and API monitor test panel — a monitor can be run on demand from its form and the resulting steps inspected, alongside a rewritten inline HAR viewer.
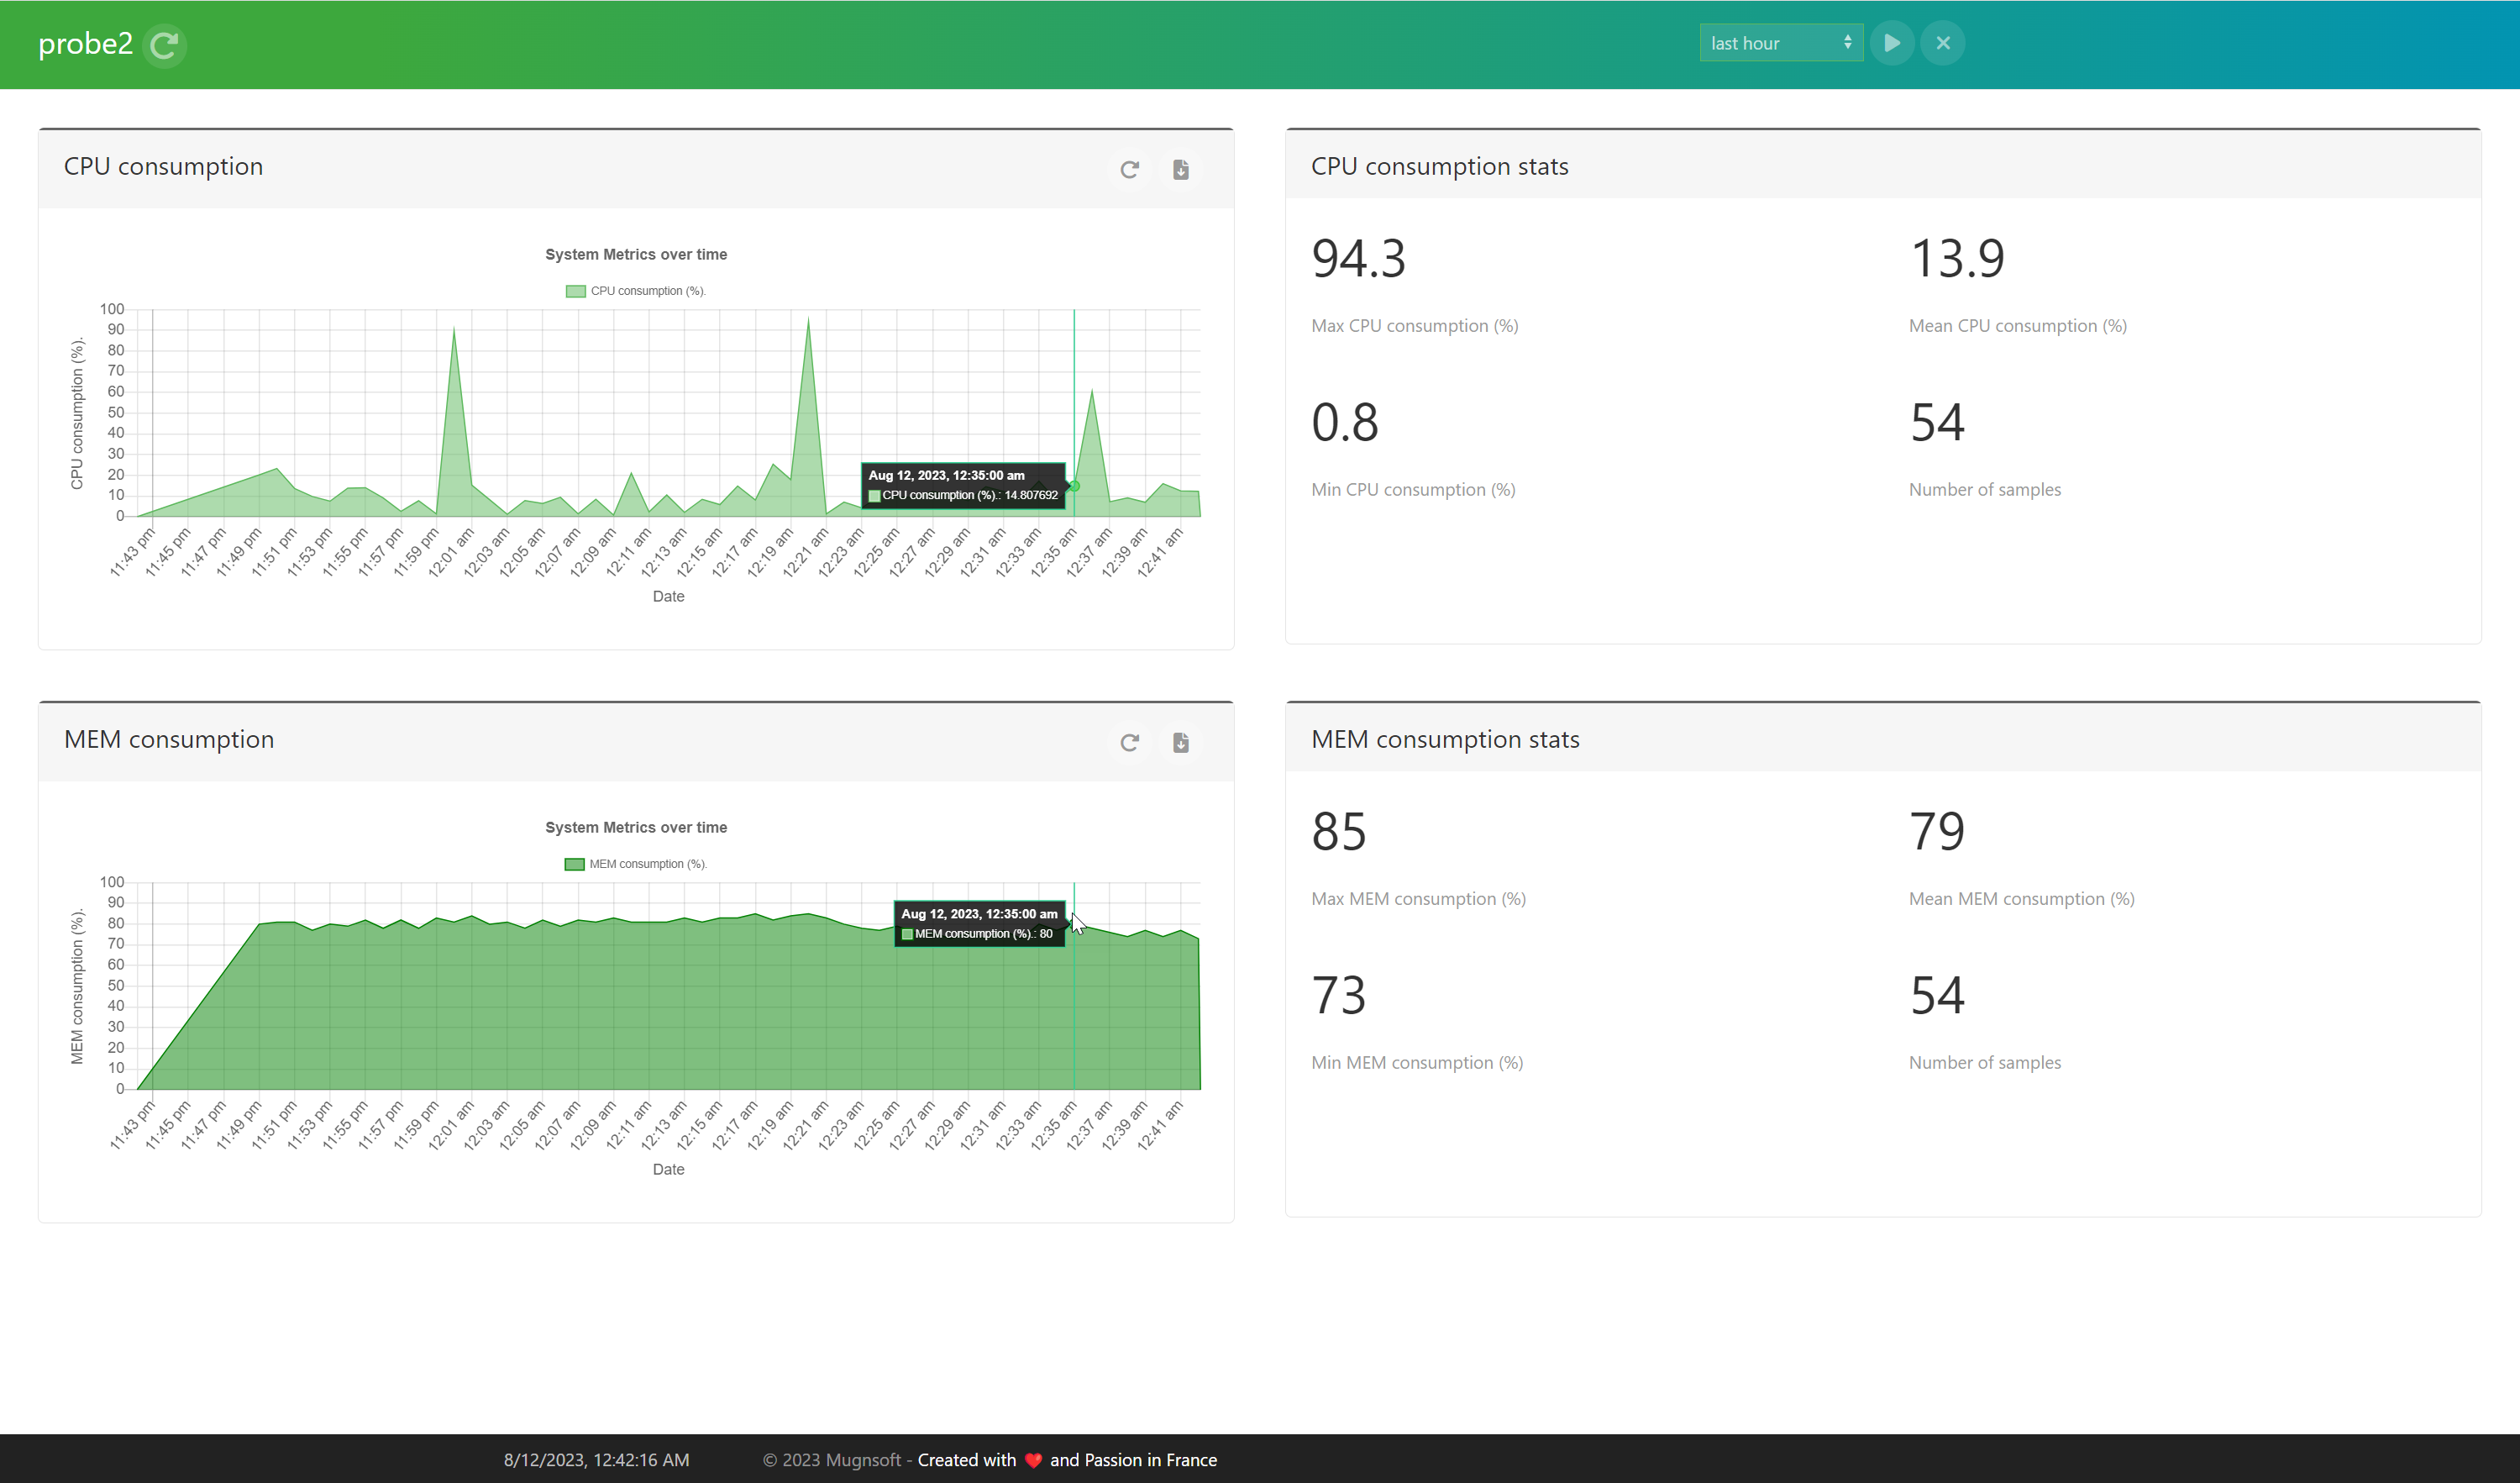
- CPU iowait and TCP socket count added to system monitoring on the probe side.
▲ Improvements
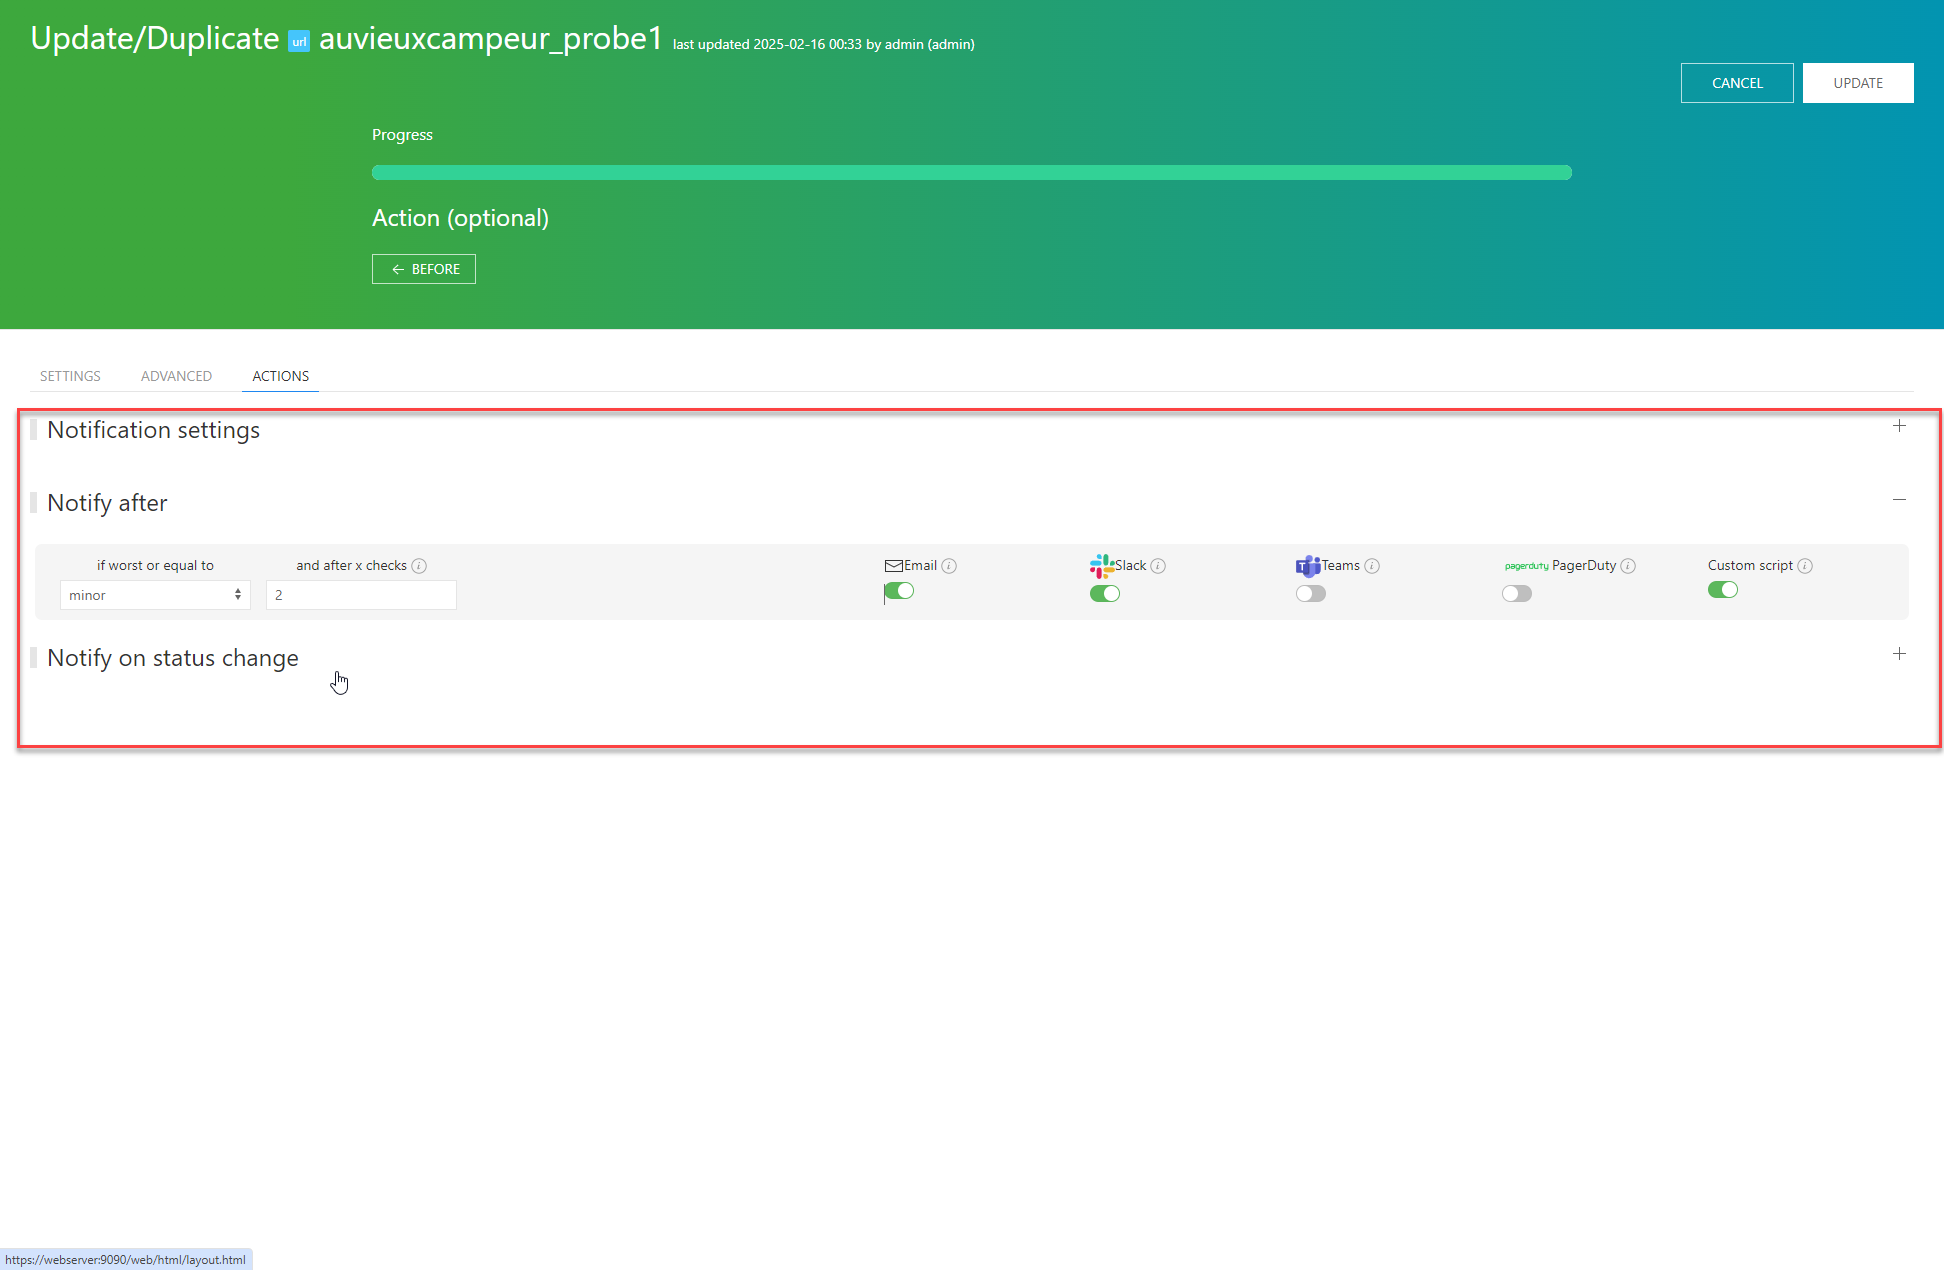
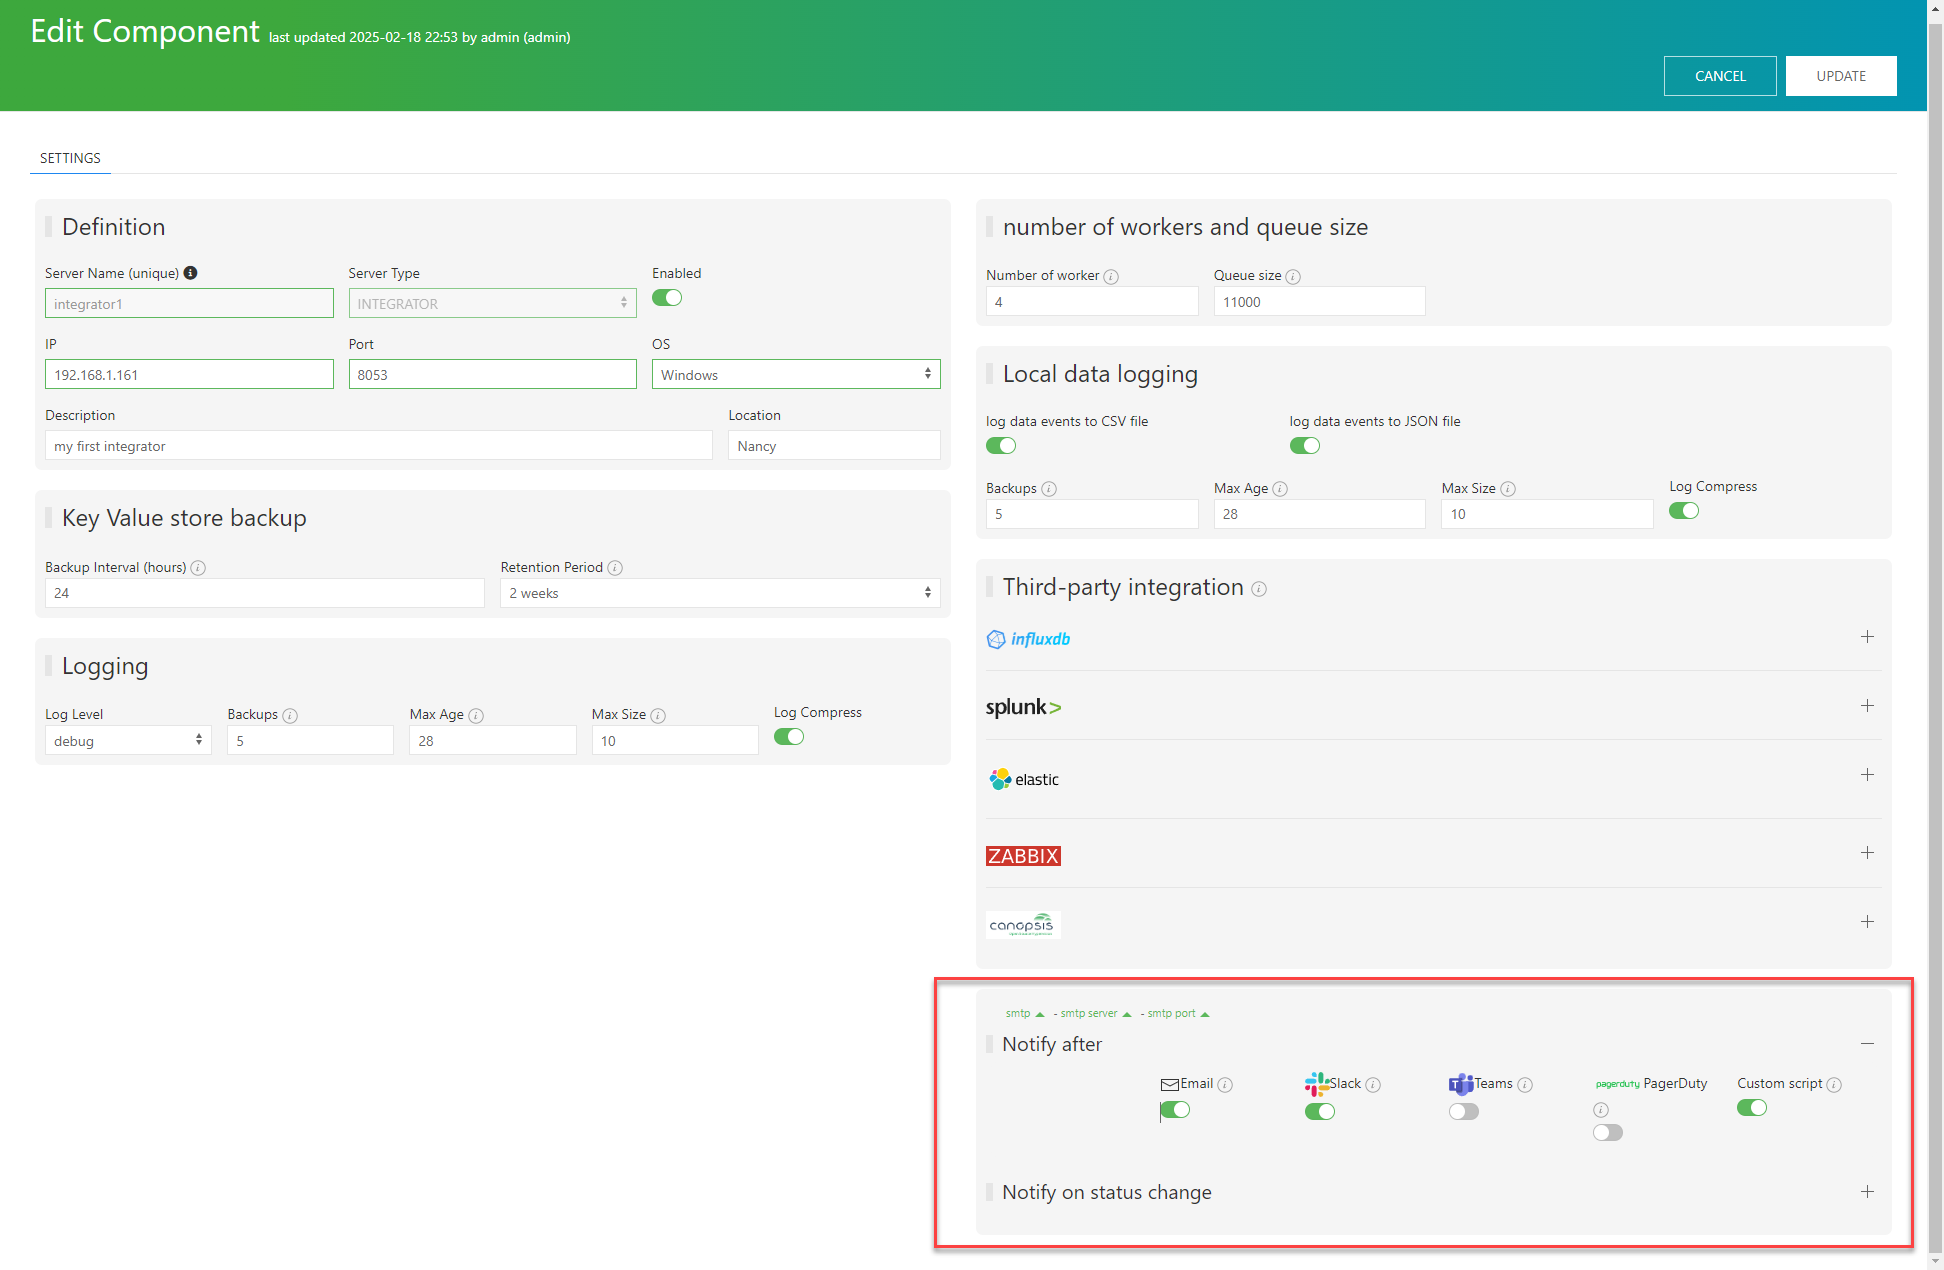
- Alert notifications are unified: e-mail, Slack, Teams and PagerDuty messages all carry the monitor type, the originating probe and a status colour, and look identical whether they were sent directly by a probe or routed through the integrator.
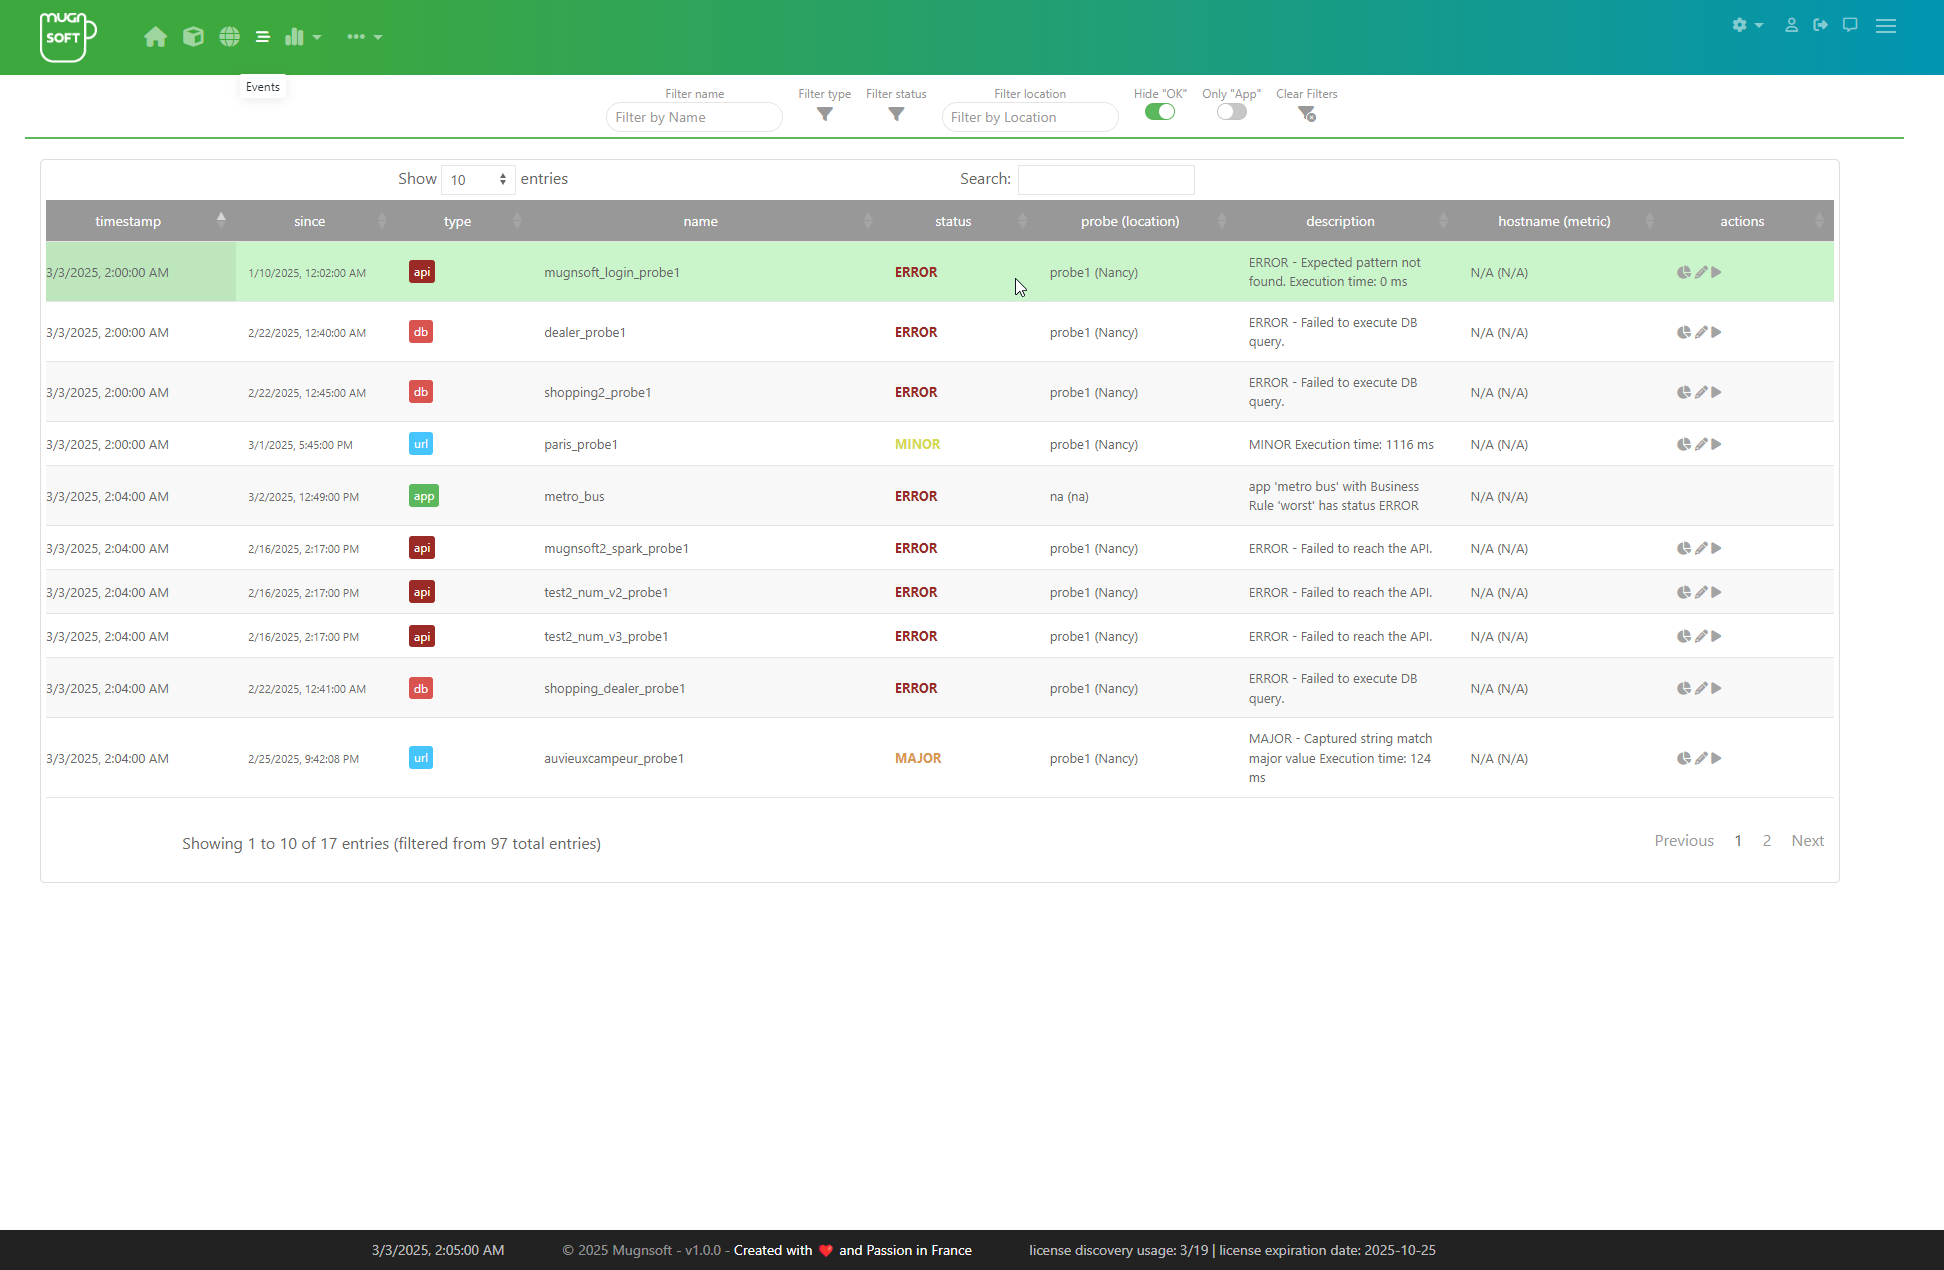
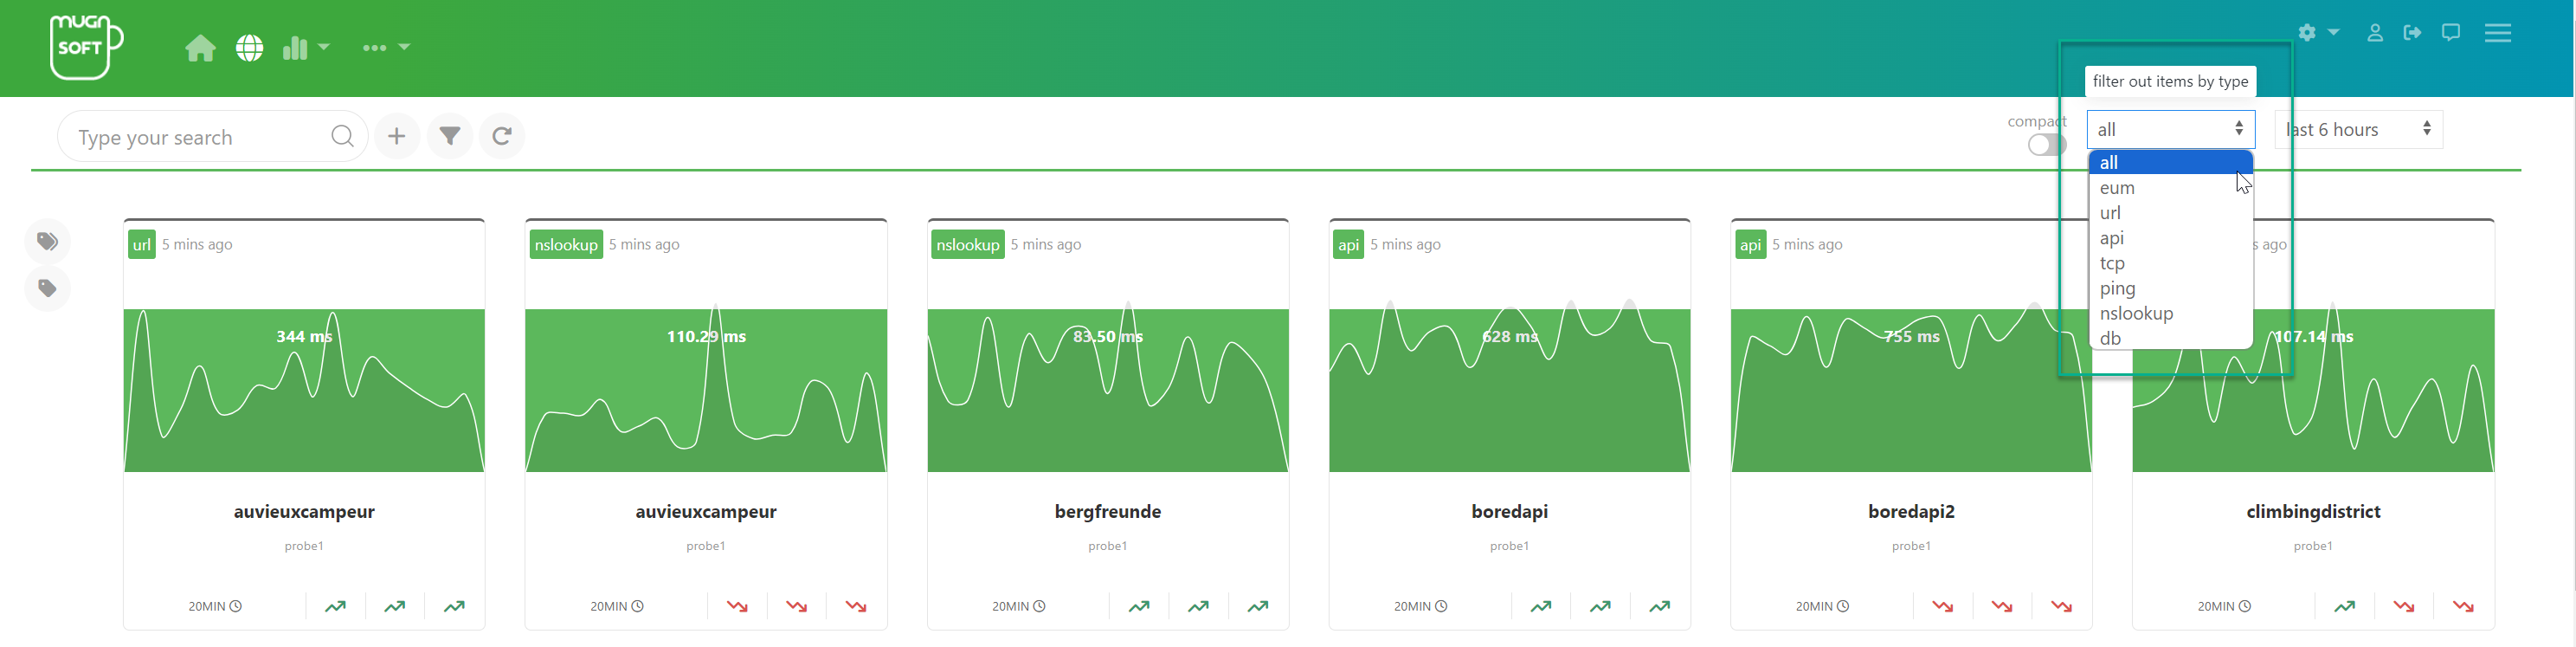
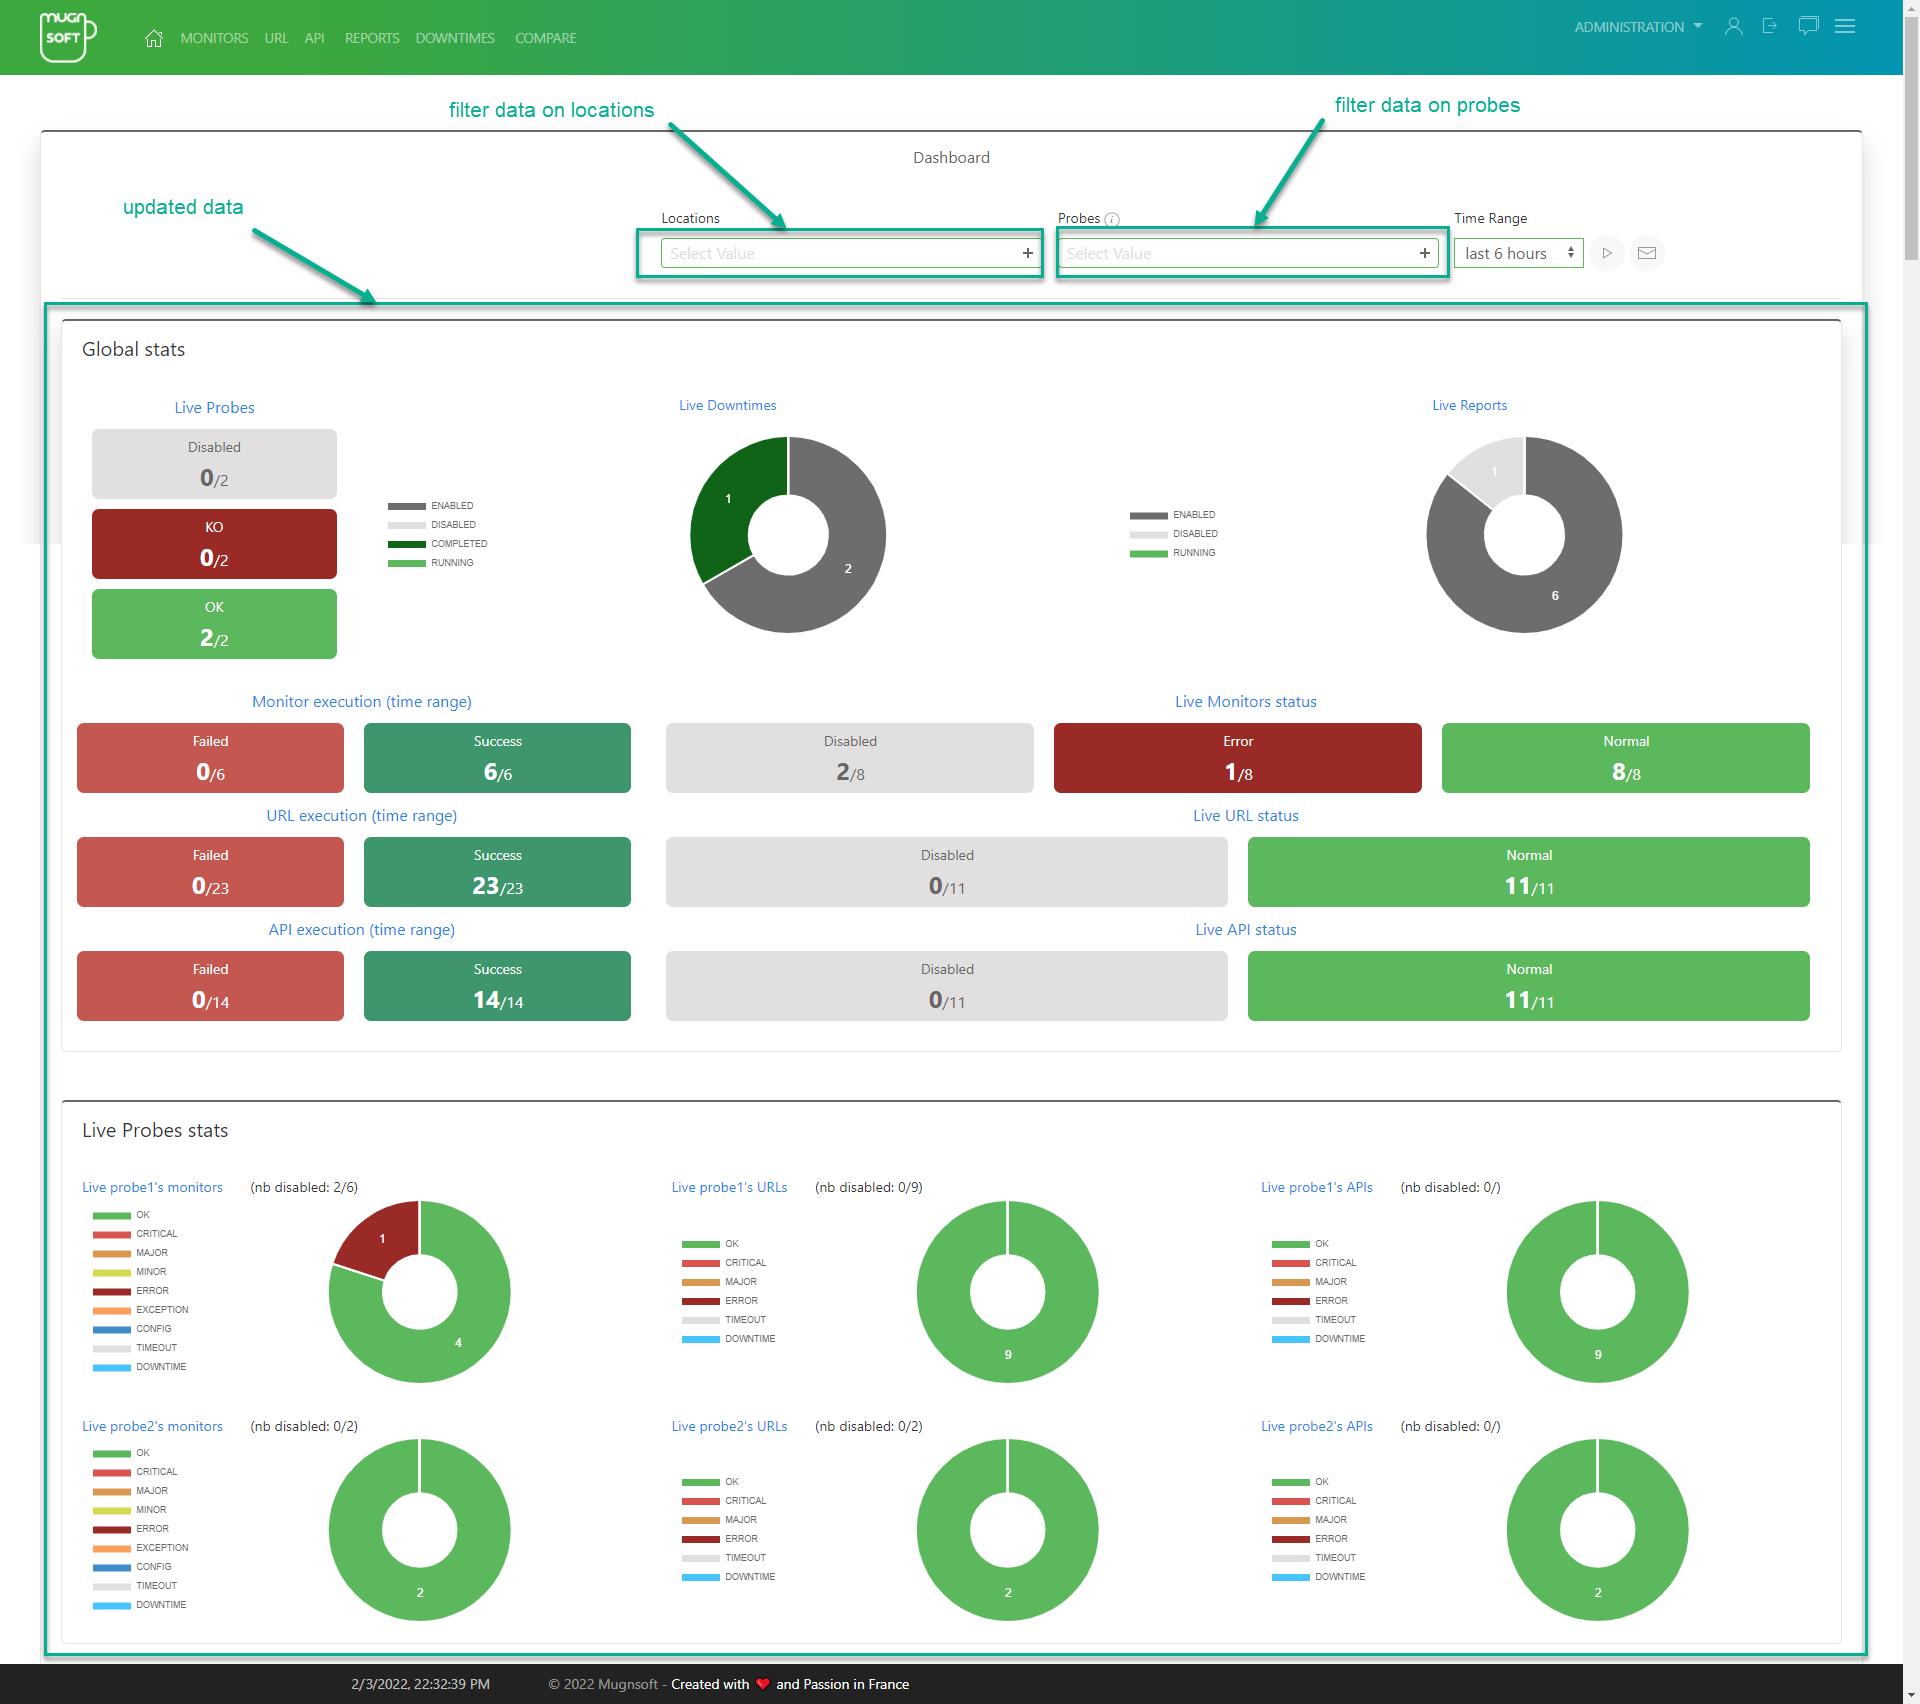
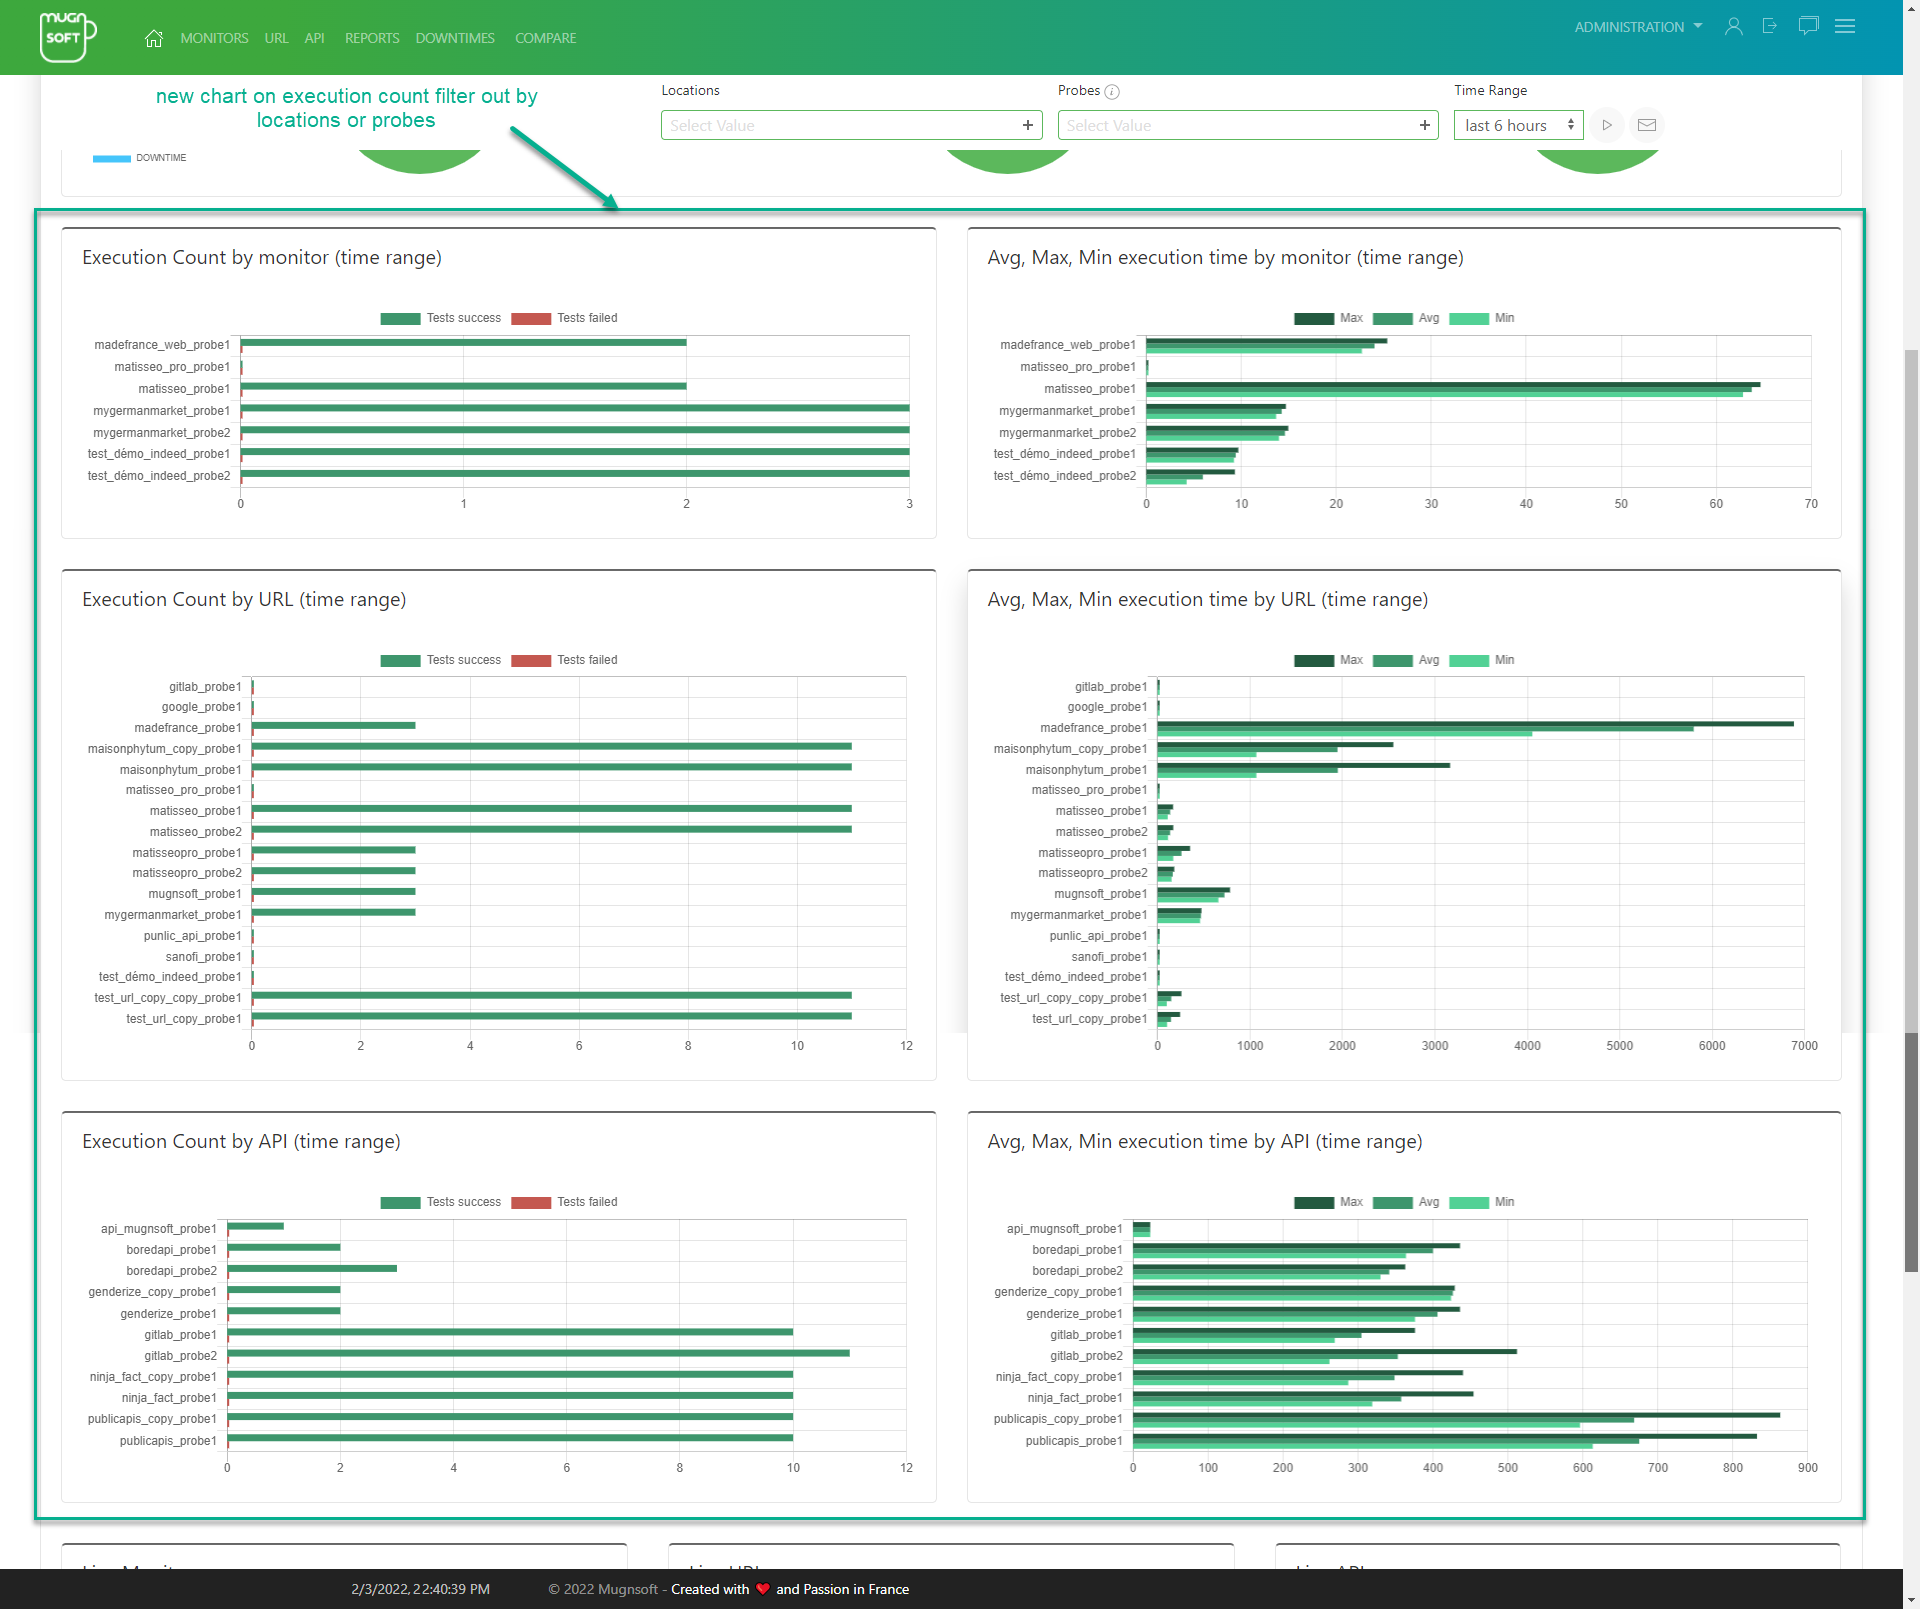
- The consolidated monitor listing gains a multi-select type filter, paging controls moved into the table header, and a layout consistent across the monitor, application and server tables.
- Loopback traffic is collapsed into a single edge per flow, with direction taken from the listening socket; loopback capture itself is toggleable per agent.
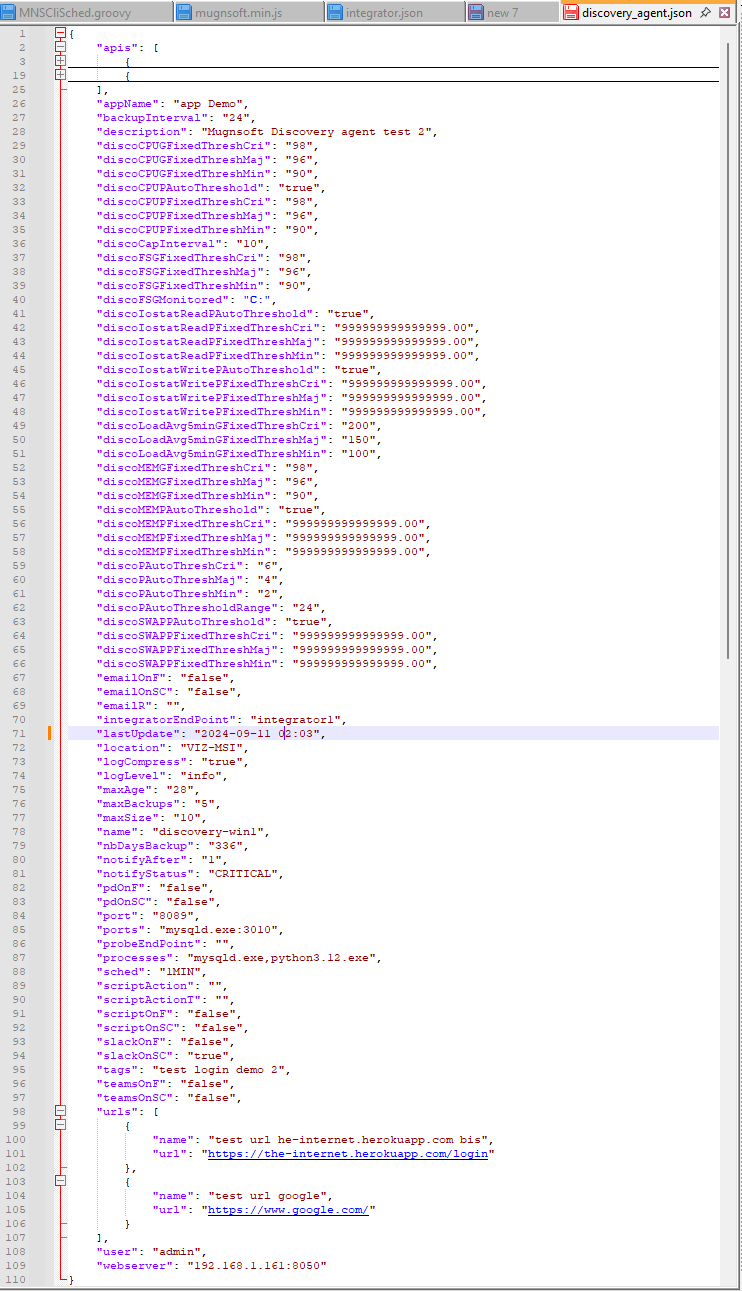
- Discovery thresholds treat an empty value as unset everywhere, and report validation errors and warnings when a configuration is saved.
- Stricter date and time validation on URL and API pattern checks.
- License validation is cached instead of re-read on hot paths, and logs a single line rather than repeating itself.
- Scheduled jobs are panic-protected on both webserver and probe: a failing job no longer takes the scheduler down with it.
- Repository backup supports a self-managed GitLab base URL, with inline setup help for both GitLab and GitHub.
- The component configuration builder introduced in v3.2.0 now covers URL and API monitors, log rules, folder rules, traffic capture and notification routing, and the generated JSON can be copied as well as downloaded.
- Interface polish: synchronised chart hovering and save-as, a shared spinner component, stacked off-canvas panels, and discovery views served on the read-only DMZ front server.
- Training material (Viewer, User and Administrator decks, English and French) refreshed for this release.
✕ Bug fixes
- Sentinel agent threshold computation: flat series are skipped, empty performance windows no longer produce absurd baselines, and a minimum sample count is required before a baseline is trusted.
- Loopback process monitoring attributed traffic to the wrong process.
- Discovery agent thresholds were not reflected in the details panel.
- Integrator external-services connectivity check.
- Directory metrics: file counting, recursive counting and total size corrected, including for missing directories and disabled rules.
- Pattern-group metric exposure, export and import of URL and API monitors, and table layout and filter regressions on the consolidated listing.
⬢ Component updates
- Sentinel discovery agent — protocol identification with per-flow caching; log monitoring hardened against rotation by truncation and by rename, with multi-line joins, captured line samples, throughput burst/silence and staleness checks; directory metrics reworked; loopback edge collapsing; capture status reporting.
- Monitoring probe — bulk OID test and walk, WMI query test and class browsing behind the configuration assistants; content-type-aware API request bodies; date/time validation on pattern checks; auto-threshold computation reworked; probe-owned process detection to clean up orphaned browser and CLI processes; Linux install/uninstall scripts and concurrency rework.
- Integrator — external-services connectivity check corrected, and alert payloads aligned with the new notification format.
- Predictive analytics — shipped as a standalone packaged runtime, with consistent window and horizon resolution, and early stopping enabled only when the time range actually yields a validation batch (with an explicit warning when it does not).
Mugnsoft